


From Chaos to Clarity: How AI Turned a 5-Hour Spreadsheet Nightmare into a 15-Minute Win
We took a messy spreadsheet with tons of financial data, mis matched columns, and lots of confusion and turned it into a success story that made them look good and saved them countless hours.

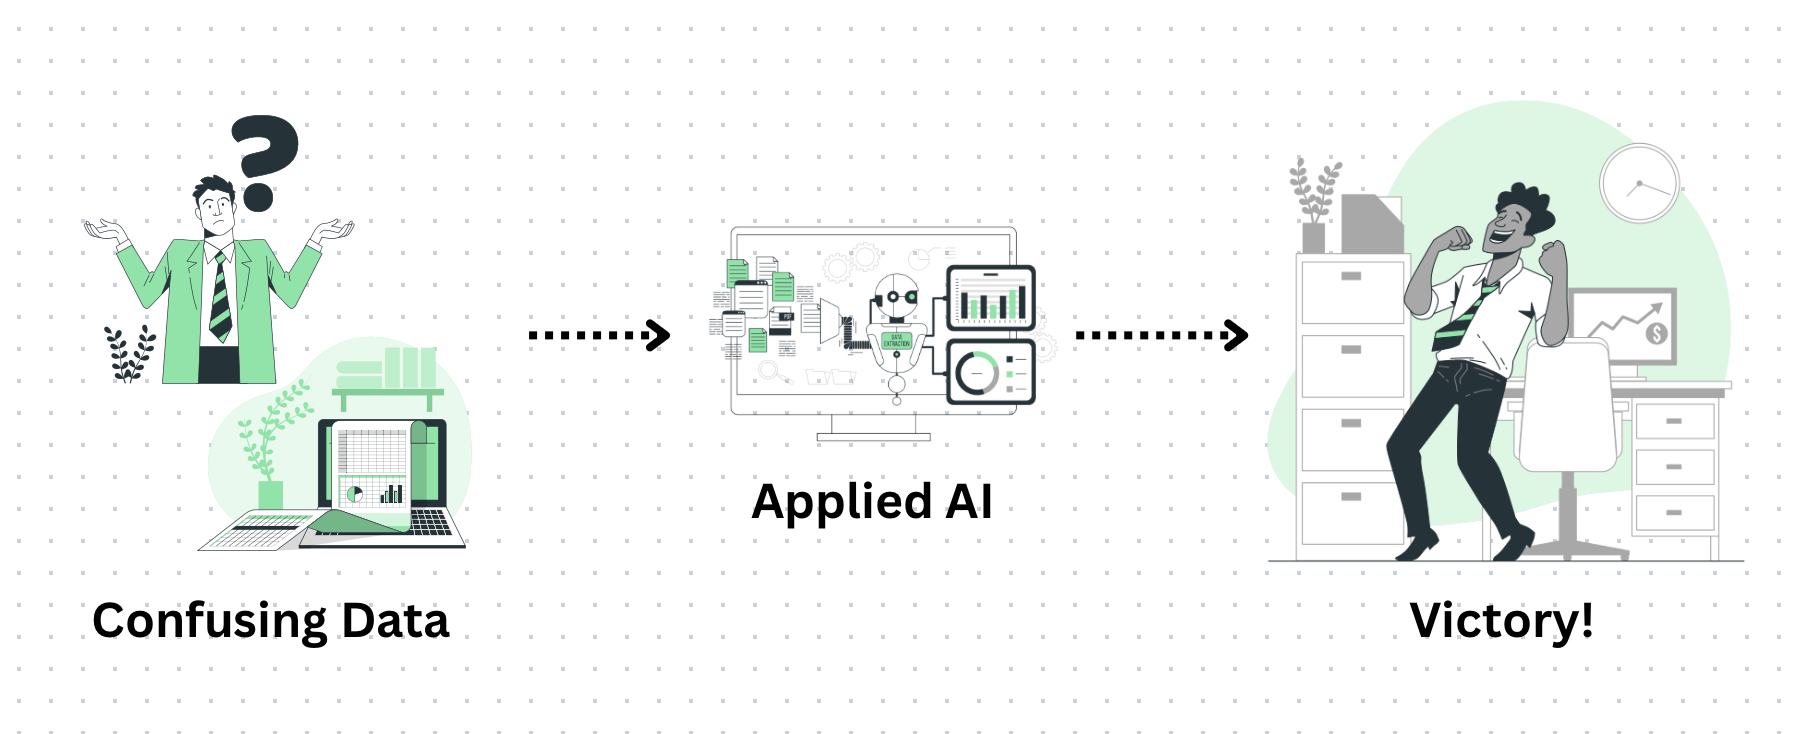
One of my recent clients came to me with a problem that probably sounds familiar: a giant spreadsheet packed with years of financial data—and no easy way to make sense of it.
Every time they needed to understand trends or generate reports, it took over 5 hours of manual work. Think: hunting through inconsistent names like “GameStop” vs. “Game Stop,” sorting incomplete columns, fixing weird formatting, and trying to summarize thousands of rows by hand.
They weren’t doing anything wrong. The data was just messy, and Excel wasn’t built to tell stories.
And honestly, they were too busy running the actual business to spend hours cleaning up spreadsheets every week.
So we used AI to flip the script.
We took that spreadsheet and layered an AI model on top of it—so now they can literally ask it questions like:
“What categories are we missing data for?”
“Can you summarize trends by business type?”
“Which rows have potential duplicate companies?”
“Can you normalize all the business names?”
“Where are we missing money?”
“Where have we over paid?”
It also helped restructure columns, find fuzzy matches, and output clean data without ever touching the original file.

🔄 And once it was working, it became reusable. Drop in fresh data, run the same analysis again—done in about 15 minutes.
It wasn’t magic. It was just the right tools, applied in a way that fits their real workflow.
If you’re staring at a spreadsheet that makes you groan… this kind of AI isn’t hypothetical.
It’s something you can start using today—without hiring a data scientist.
Want to see how it could work for your business?
Reply or reach out—I’m happy to walk you through it.